

Elevate is an excellent Free add on for Strava that is available for Chrome, Opera and Firefox browsers and works with Strava Free and Strava Summit. Elevate adds many important physiological & performance metrics and tracking tools to Strava.
Elevate adds a dropdown to the Strava menu that lets you directly access the Elevate App
Elevate also adds the following elements to the Strava Dashboard
- Summary Physiological & Performance Metrics per Activity – On Activity Page
- Detailed Physiological & Performance Charts per Activity – Click Button On Activity Page
- Best Splits and Segment Efforts Metrics – On Activity Page
The Elevate App Menu Items
- Activities
- Fitness Trends
- Year Progressions
- Global Settings
- Athlete Settings
- Zones Settings
- Strava Dashboard
- Donate
Elevate Menu Items added to Strava
- Activities
- Fitness Trends
- Year Progressions
- Global Settings
- Athlete Settings
- Global Heatmap
- Donate
- FAQ
- Release Notes
- Various Social Links
Descriptions of Elevate Features and Views
Activities

This is a filterable table showing key metrics for all activities. Here’s the full list of columns available. You can add or remove columns as required.
- Date
- Name
- Type
- Moving Time
- Distance
- Elevation Gain
- Avg Moving Speed
- Avg Pace
- Move Ratio
- Avg Total Speed
- Best 20min Speed
- 25% Speed
- 50% Speed
- 75% Speed
- σ Speed
- Grade Adj. Pace
- Best 20min Pace
- 25% Pace
- 50% Pace
- 75% Pace
- Running Stress Score
- Running Stress Score / h
- Avg HR
- Max HR
- Avg HRR
- Max HRR
- HRSS
- HRSS / h
- TRIMP
- TRIMP / h
- Best 20min HR
- Best 60min HR
- 25% HR
- 50% HR
- 75% HR
- Cadence % Moving
- Cadence Time Moving
- Cadence Avg Moving
- σ Cadence
- Cadence Count
- 25% Cadence
- 50% Cadence
- 75% Cadence
- Climbing Avg Cadence
- Flat Avg Cadence
- Downhill Avg Cadence
- Distance / Revolution
- Power Meter
- Avg Watts
- Avg Watts / Kilograms
- Weighted Power
- Weighted Power / Kilograms
- Best 20min Power
- Variability Index
- Power Stress Score
- Power Stress Score / h
- 25% Watts
- 50% Watts
- 75% Watts
- Avg Elevation
- ElevationDescent
- 25% Elevation
- 50% Elevation
- 75% Elevation
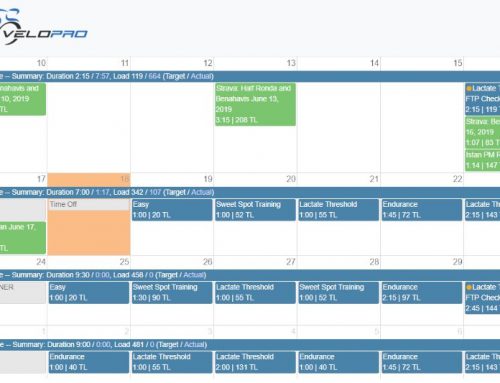
Fitness Trends
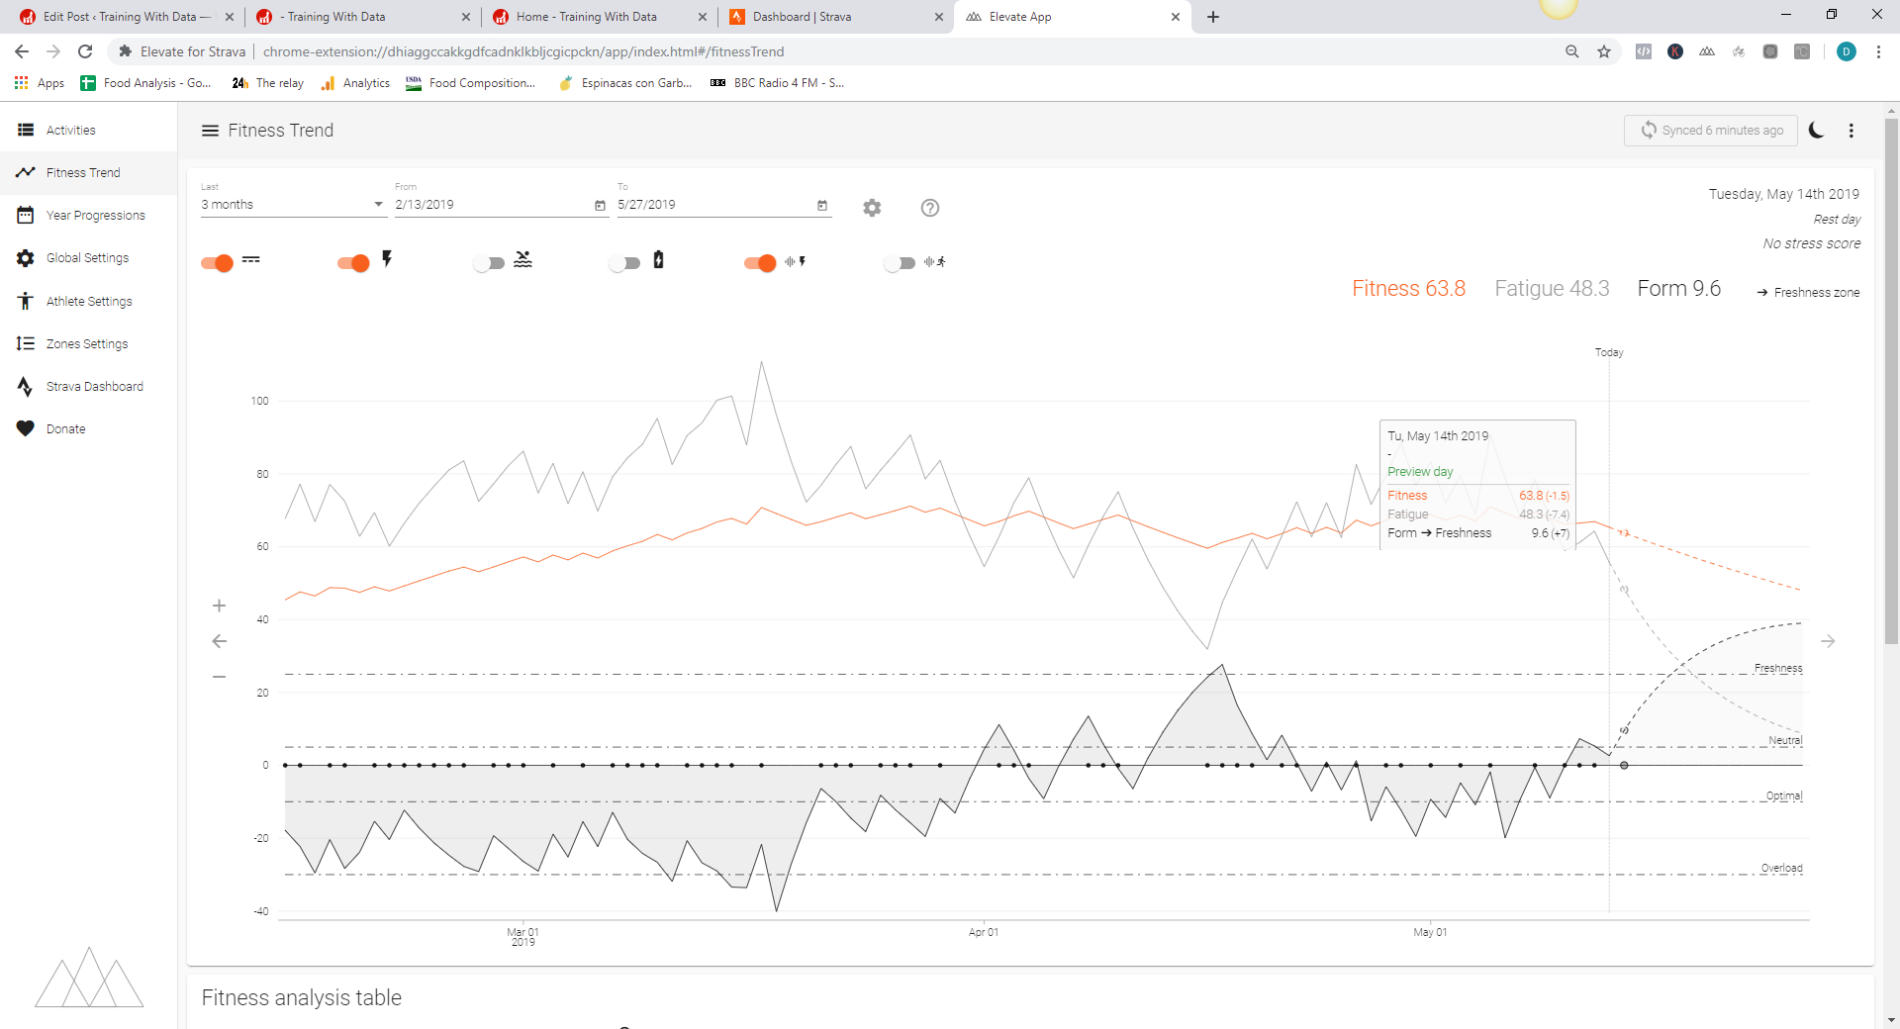
The fitness trend is a "black box" that models the response of your body when exposed to various efforts performed over time. Your body reacts to these stimuli with "fatigue" and creates a "background fitness base" that makes you "stronger" for the subsequent efforts. To fully use the acquired fitness, you have to be in "form," meaning that you have overcome fatigue with rest and recovery. To put numbers on fitness, fatigue and form over time, each effort has to be quantified. This is where "stress scores" are used.
Elevate Fitness Trends is similar to Training Peaks Performance management chart (PMC) which is the gold standard for managing your training schedule and ensuring you reach peak performance when you need to.
The idea behind these performance management charts (PMC) is that Fitness builds up over the long term (42 Days) (Chronic) whereas fatigue increases over the short term (7 Days) (Acute)
The difference between fitness and fatigue (based on yesterday’s results) are your Form, which is your ability to perform well.
One way to look at it is to consider an extremely fit athlete having a massive ride yesterday. Despite his fitness he is unlikely to perform well today due to fatigue.
PMCs take this concept and apply it over an extended period which allows you to spot trends and manage training taper (the reduction of training to optimize form by a set date).
The key elements to consider are as follows:
Training Stress Score (TSS)
Every workout you do is assigned a training stress score based on duration and how intense the workout was relative to your threshold (FTP).
Fatigue (Acute Training Load, or ATL)
Fatigue is calculated by taking an exponentially weighted average of the Training Stress Score (TSS) over the previous 7 days. Activities with a high training stress score cause Fatigue for that day to rise sharply in response. You do a hard workout today and you will feel it in the coming days.
Fitness (Chronic Training Load, or CTL)
Fitness is calculated by taking an exponentially weighted average of the Training Stress Score (TSS) over the previous 42 days, and reflects the training you have done over the last 3 months.
Note that the workouts you did two weeks ago will impact your fitness more than the workouts you did 8 weeks ago.
As Fitness increases then so does Fatigue, but at a greater rate.
Consistent training is marked by a steady rise in Fatigue and Fitness where as a sharp drop might indicate time off due to sickness or injury.
Form (Training Stress Balance, or TSB)
Form is calculated by subtracting yesterday’s Fatigue from yesterday’s Fitness; the generally accepted rule of thumb is that the form number should be slightly negative up to positive 25.
Tapering
Tapering is the act of reducing your training in a way that you shed fatigue at a greater rate than you lose fitness so that by the time of your event you are at peak fitness AND not fatigued.
This means you will be on top Form for optimum performance.
Depending on the Form value, you can manage and plan your training to reach or avoid a particular zone. These are the Values and Zones used in Elevate Fitness Trends:
+25: Transition zone
Athlete is on form. This value is often reached when an athlete has an extended break. (e.g. illness, injury or end of the season).
+5 to +25: Freshness Zone
Athlete is on form. Ready for a race or big day(s).
-10 to +5: Neutral Zone
Zone reached typically when an athlete is in a rest or recovery week. After a race or hard training period.
-30 to -10: Optimal Training Zone
Zone where an athlete can build an effective fitness.
-30: Over Load Zone
Athlete is on overload or over-training phase and should take a rest!
Year Progressions
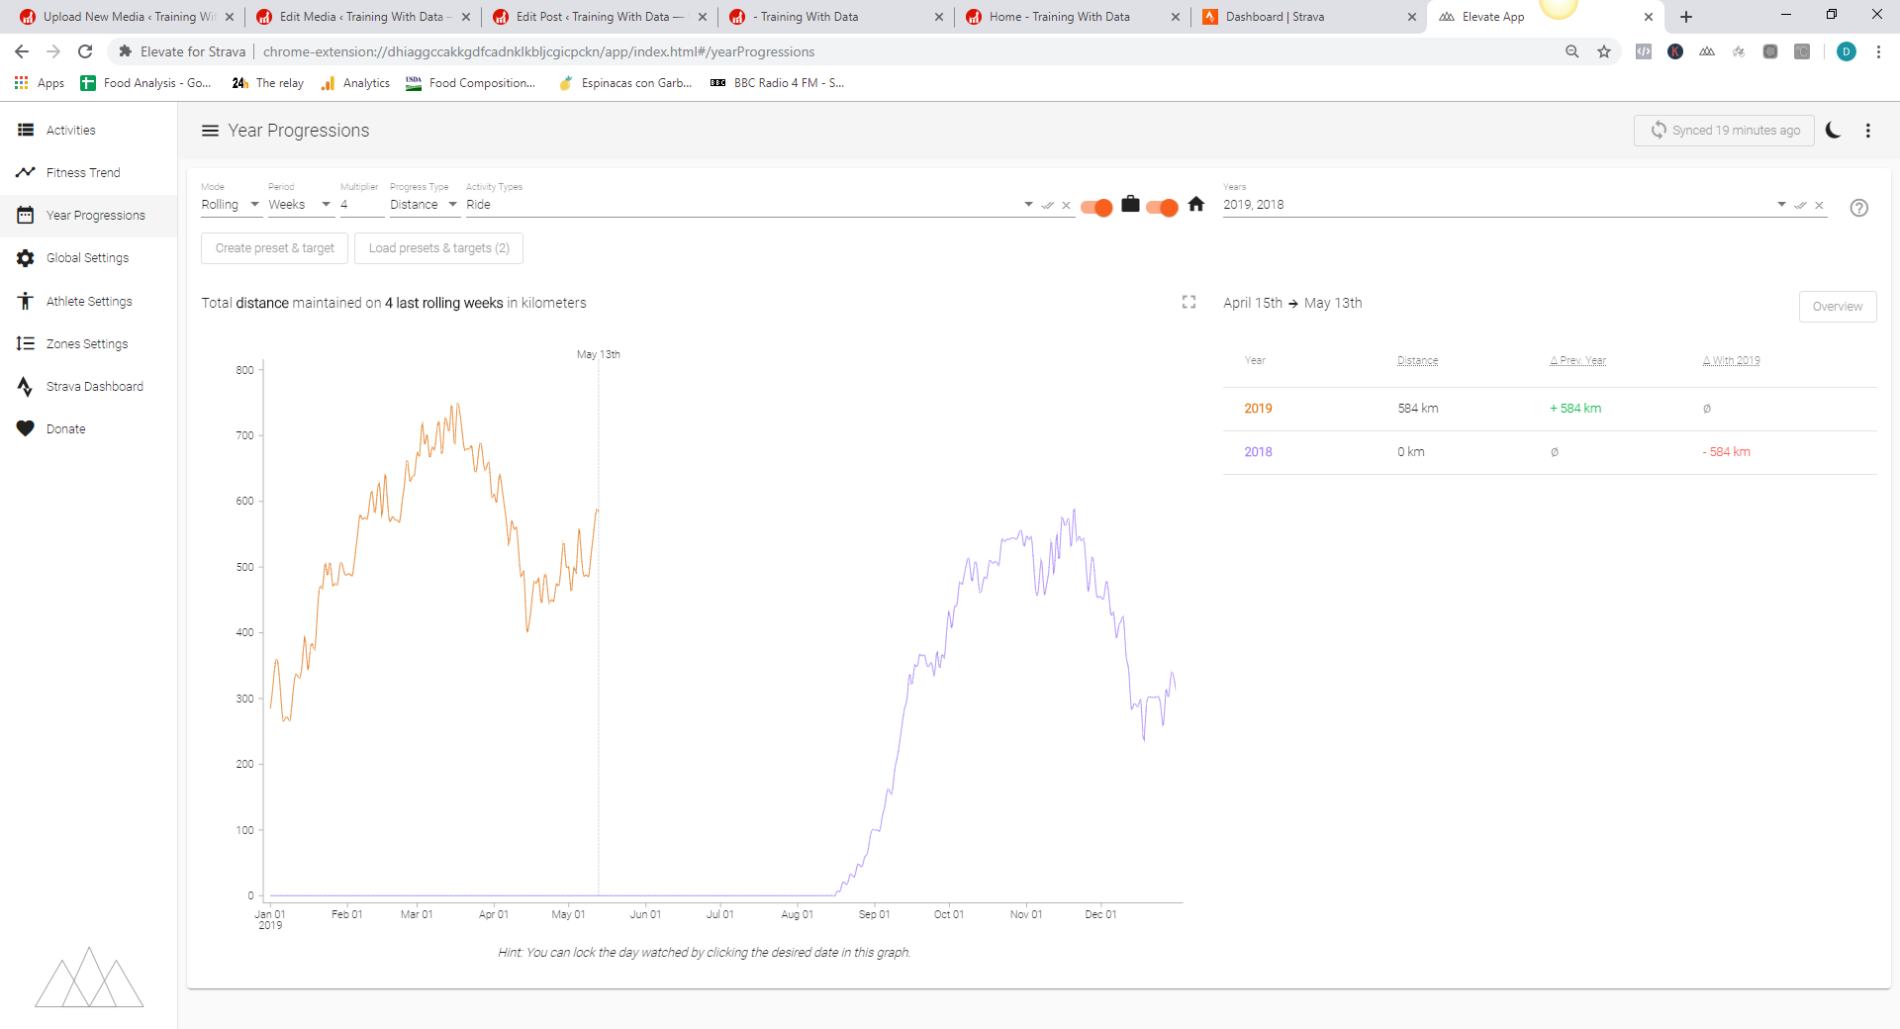
The year to date progression mode evaluates the total"distance", "time", "elevation" OR "activity count" from the beginning of a year to a specific day of the year and compares it to previous years.
You can choose between YTD and rolling. YTD is cumulative whereas Rolling is the value for a previous period. You can hover over any part of the line to see values for the previous periods
You can also set a target for any view which will add a horizontal line showing the target. Hovering on the line at any point shows your progress towards your target.
You can save any view as a preset using the “Create preset and target” button and you can easily return to any saved view using the “Load presets and targets” button.
The overview button shows all metrics for the current view in a table.
You can select the years to include from the years dropdown.
The Question Mark Icon shows contextual Help.
Year to Date Mode Options Menu

- Progress Type Options: Distance, Time, Elevation, Count
- Activity Type: As per Strava
- Include Commutes: (Briefcase)
- Include Indoor Sessions: (House)
Rolling Mode Options Menu

- Period: Days, Weeks, Months, Years
- Multiplier: lets you set the number of Periods evaluated so for example inf the Mutiplier is set to 4 the chart shows the total Unitsmaintained over 4 last rolling weeks
- Progress Type Options: Distance, Time, Elevation, Count
- Activity Type: As per Strava
- Include Commutes: (Briefcase)
- Include Indoor Sessions: (House)
More on the "Rolling progression" mode
The rolling progression mode helps you to analyze your training volume/intensity variations over a "customise-able fixed rolling time window" which slides every day.
This is the total "distance", "time", "elevation" OR "activity count" you were able to maintain during this window. In long endurance sports, volume and intensity are the keys for success. Leaving apart intensity which can be obtained with Stress Scores (HRSS, PSS, ...), the rolling progression provides the simplest part of the equation which is hard to get right: the volume.
By combining rolling progression with "targets", you can track and ensure a defined training volume pace over time.
To enable the rolling progression, just select "Rolling" in the mode field.
How to display progression in imperial system unit?
You will find a "App system units" option in Global Settings.
Global Settings
System settings to control items such as: Units of Measurement, View and Statistical Options. Each item has a brief explanation of its use
Athlete Settings
Athletes’ settings to control items such as: Units of Measurement, View and Statistical Options.
These are used where Strava does not support the metric or it is only available in the Summit pack: For example FTP.
Currently Strava doesn’t support evolution of your physiological attributes over time (heart rate, weight, power, pace, etc). These are needed because activities' stats including stress scores are functions of these attributes.
When configured and enabled, Dated Athlete Settings will be used by all Elevate features which might need it (e.g. fitness trend).
Each item has a brief explanation of its use
Zones Settings
You can set multiple Zone values for any of these parameters
- Cycling Speed
- Running Pace
- Grade Adjusted Running Pace
- Heart Rate
- Cycling Power
- Running Power
- Cycling Cadence
- Running Cadence
- Grade
- Elevation
- Ascent speed
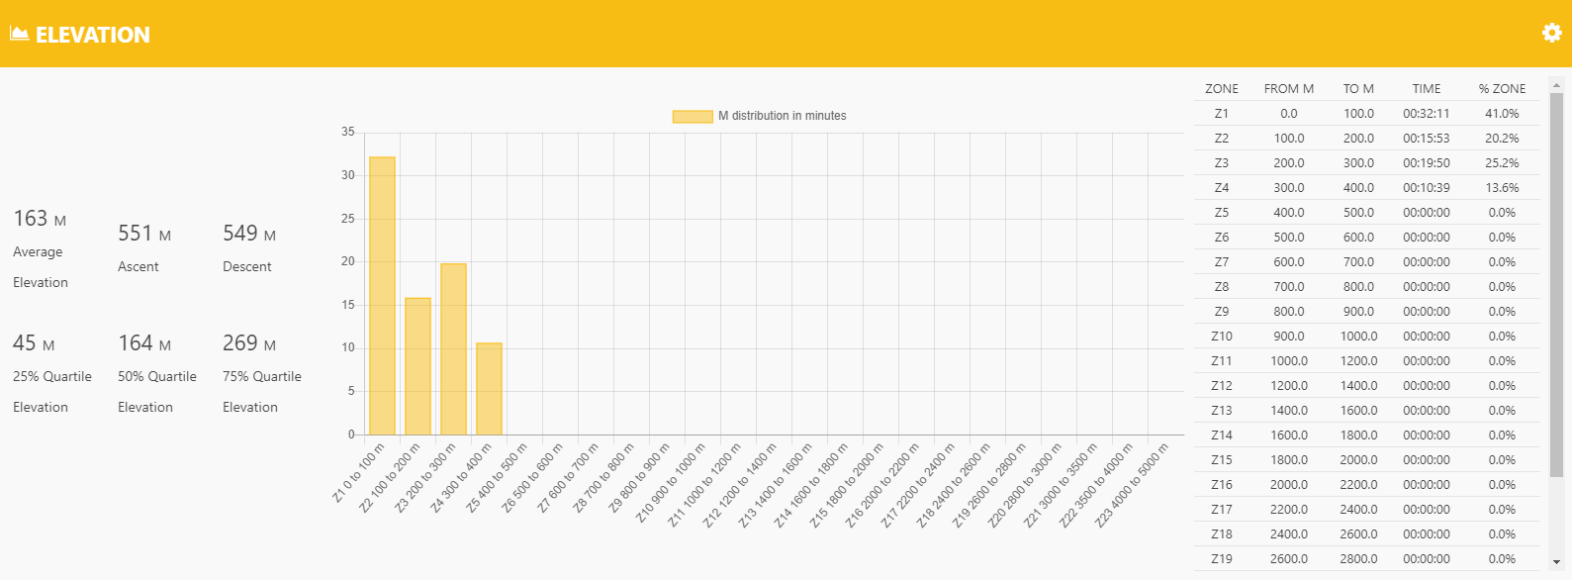
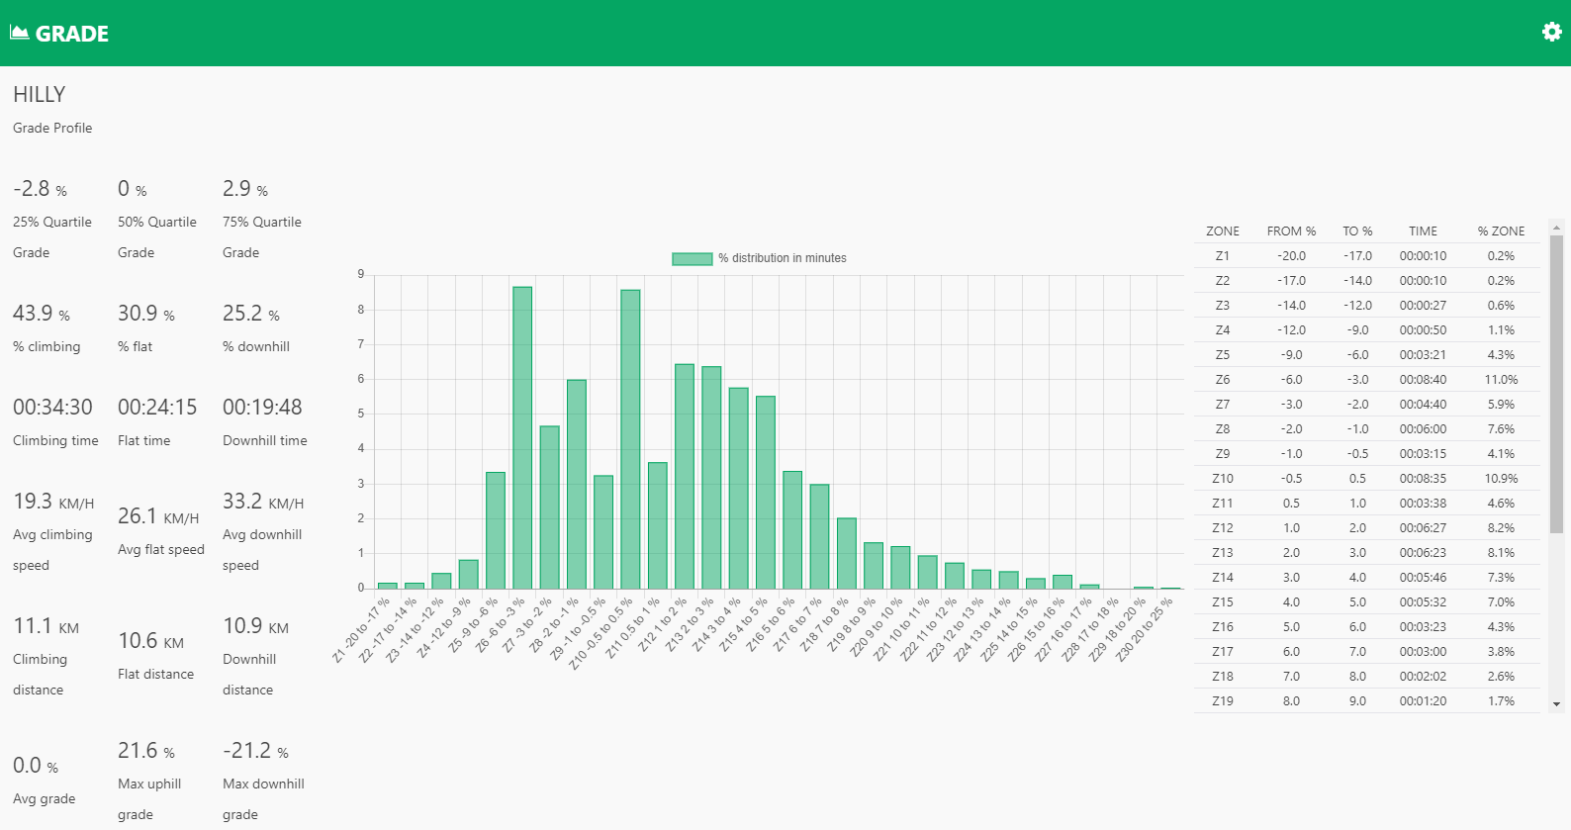
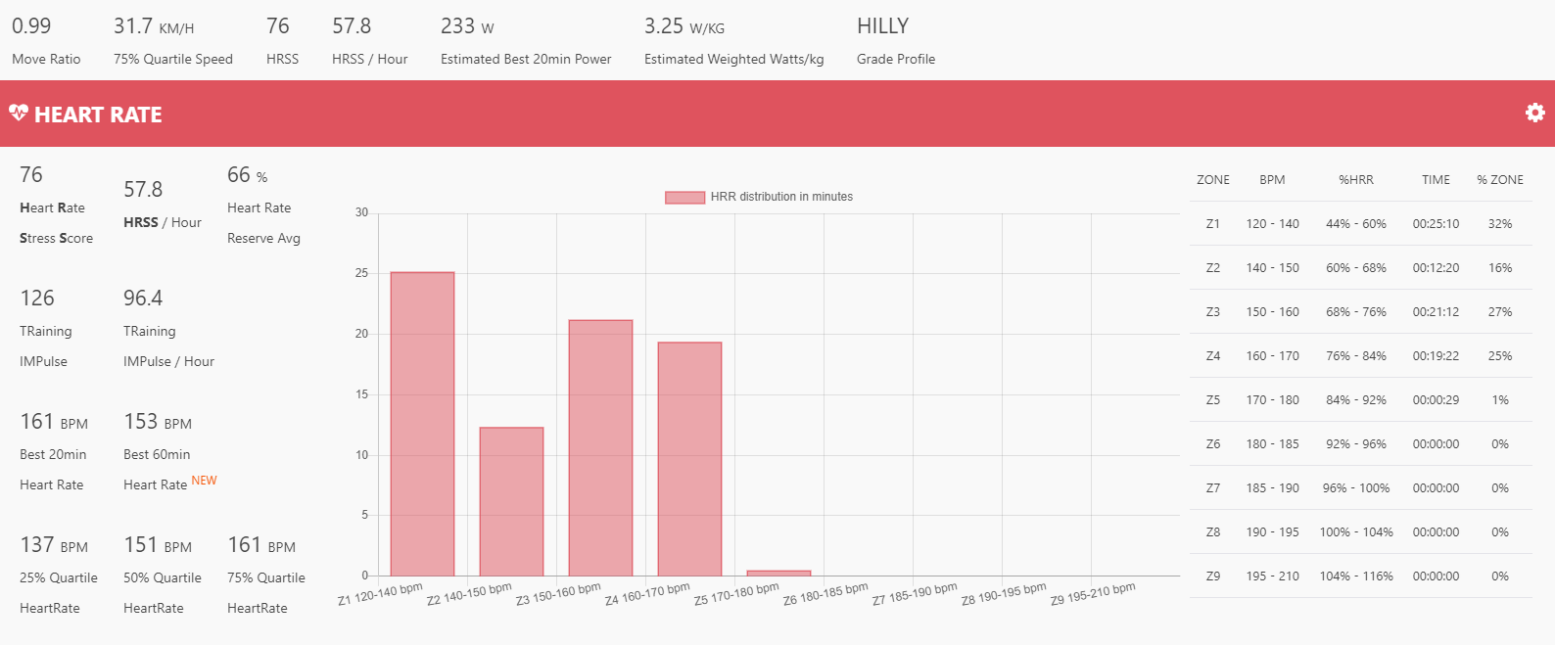
Elevate Performance Metrics view on Activity Main Page
Elevate adds this table to all of your activities:
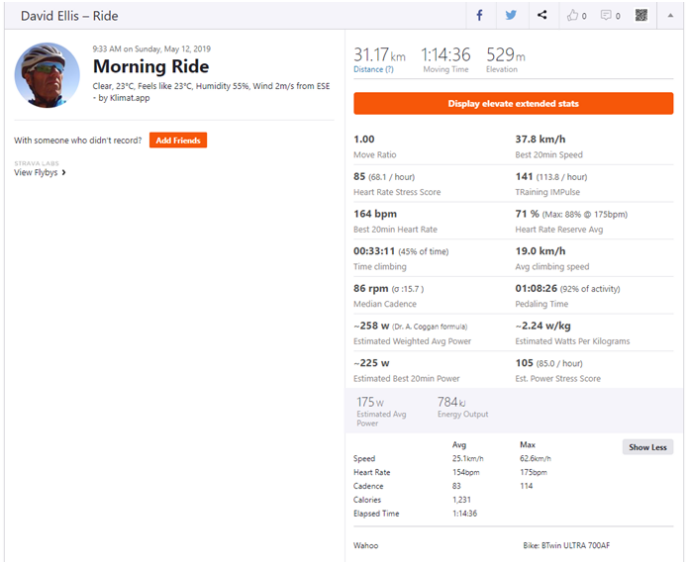
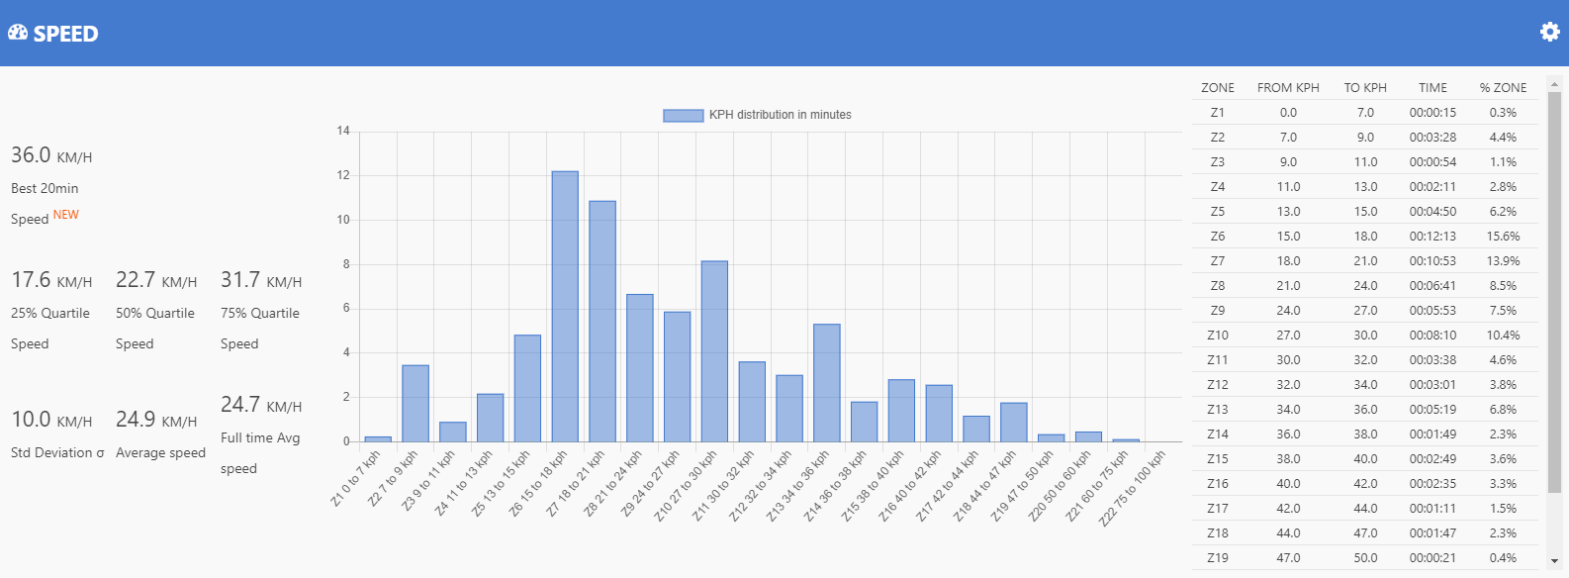
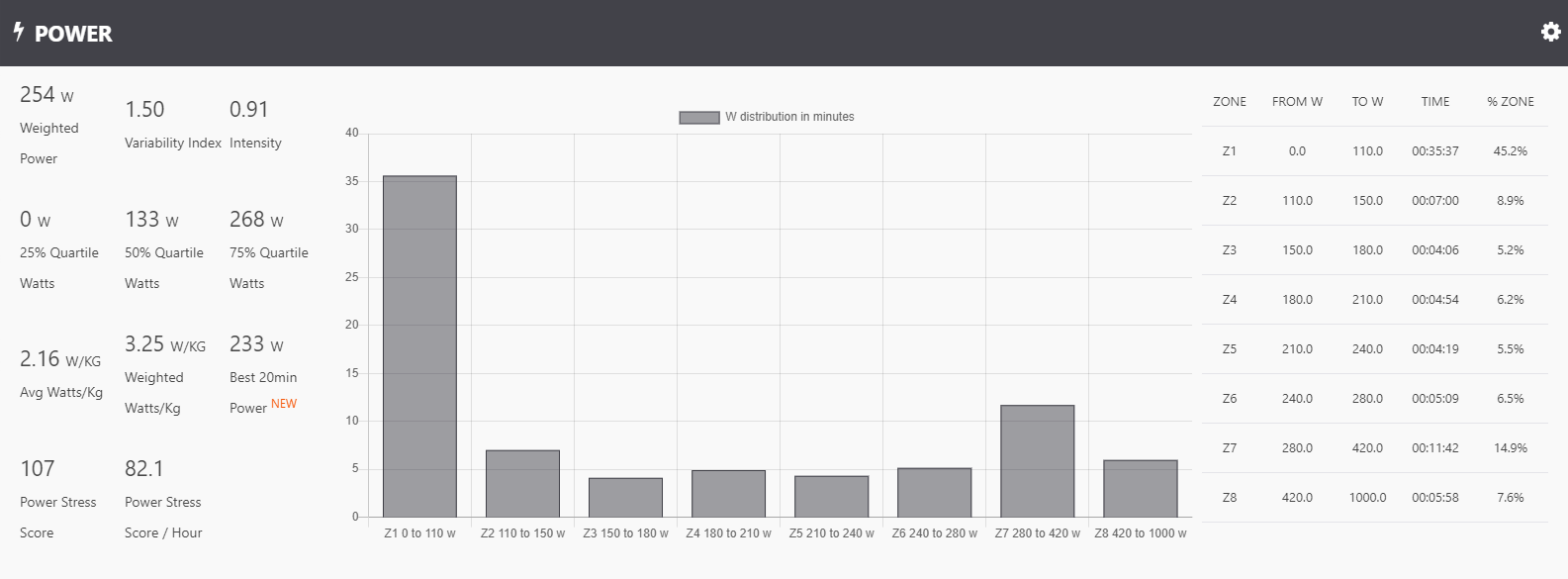
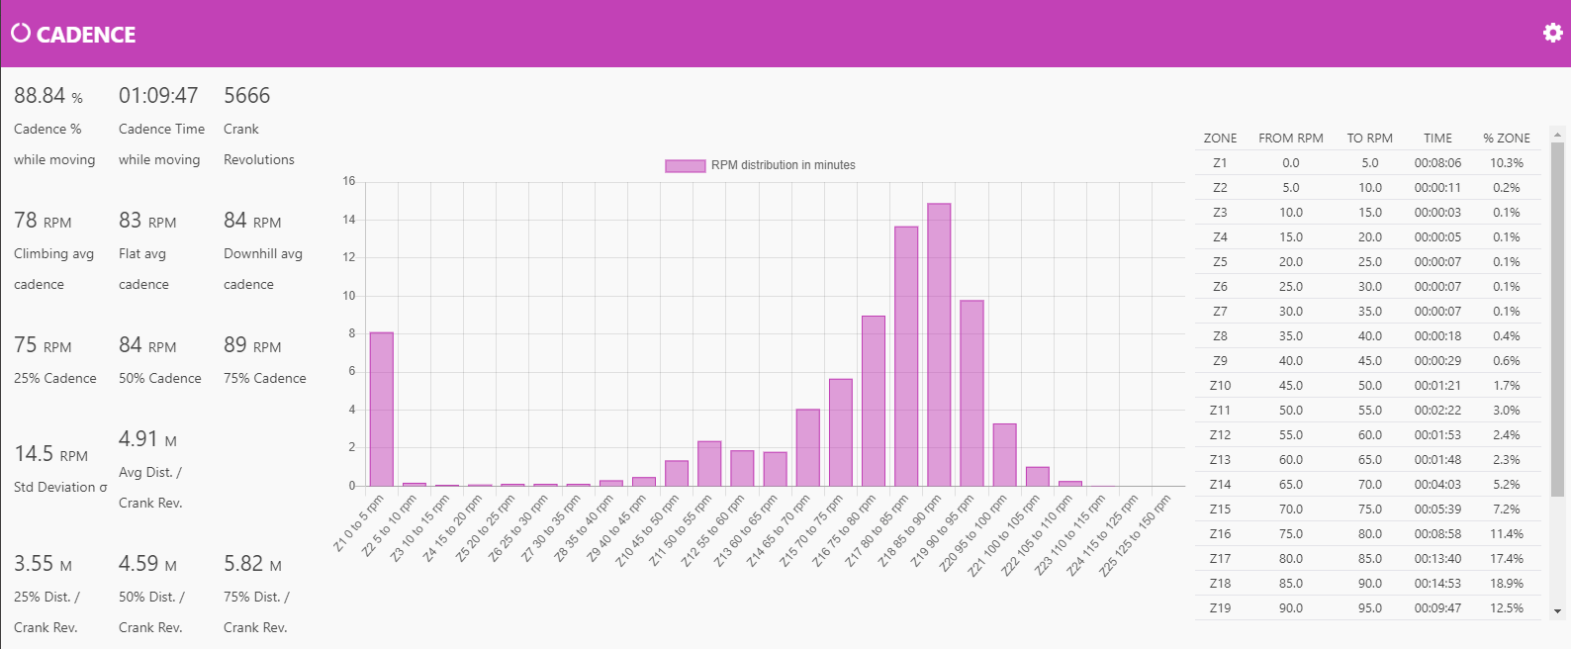
Click on the Large Orange Button “Display Elevate Extended Stats” to see detailed charts on each Metric. (See the examples at the end of this post).
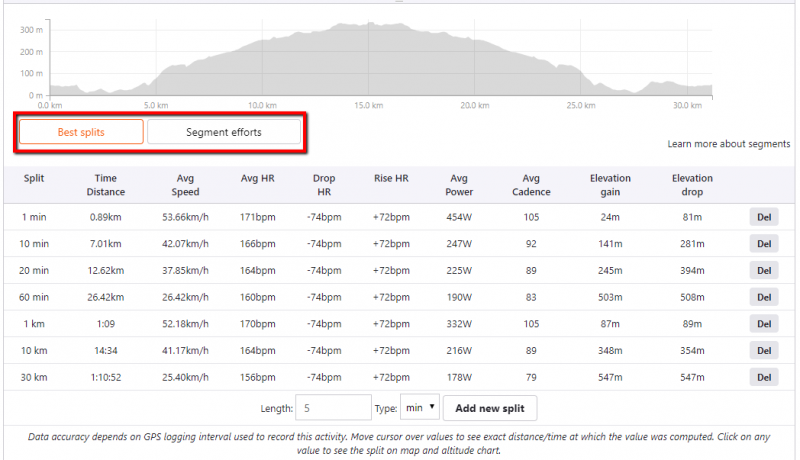
Elevate Best Splits and Segment Efforts Additions to Activity View
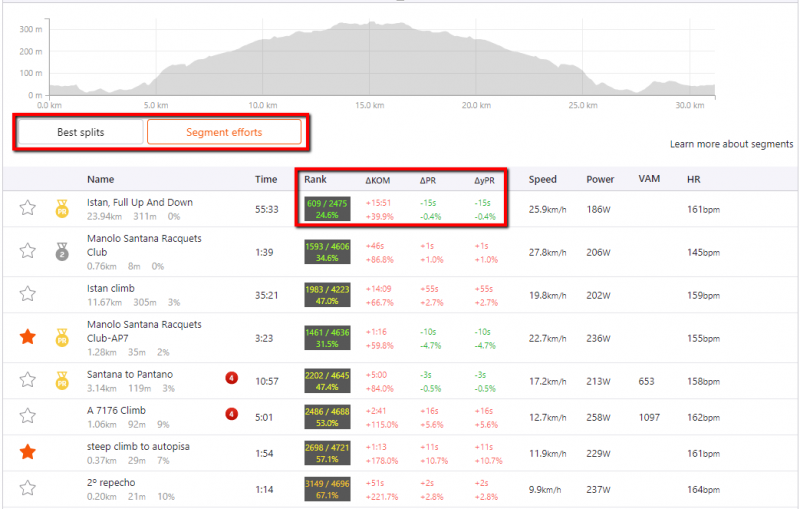
Segment Efforts
Elevate Adds four new columns to your segment analysis plus two buttons to toggle between Best Splits and Segment Efforts.
The four new columns in Segment Efforts view are:
Rank: Your Position in KOM (King of Mountain) Leaderboard/Total Competitors/Percentage of your position out of total. The colour changes from Red to Light Green the closer you get to the KOM
ΔKOM: Time Behind KOM in Seconds and Percent
ΔPR: Time Ahead (Shown in Green) or Behind (Shown in Red) your previous PR on this segment
ΔyPR: Time Ahead (Shown in Green) or Behind (Shown in Red) Your PR this year on this segment
Best Splits
Best Splits show key metrics for your best performance over a set time or distance (called a “Split”). There are 7 built in splits or you can add your own.
How to get Elevate for Strava
Visit the Elevate for Strava website
Scroll to the bottom of the page and click on the Download link for your, browser and follow the instructions
Common Stress Score Calculation Methods used by Elevate for Strava
Stress scores explained
Training Impulse (TRIMP)
Training Impulse (TRIMP). Represents a training load based on your heart activity and depends on exercise duration and intensity.
The Training Impulse stress score represents a training load based on your heart rate activity during an effort. It provides a good indicator to compare commitment between activities. It applies to all workout types since you can wear a heart rate monitor. TRIMP takes into consideration the duration and the intensity of exercise as calculated by the Heart Rate Reserve (HRR). The Heart Rate Reserve is a heart effort level according to a heart capacity.
You can set the TRIMP as default heart rate stress score calculation method in the fitness trend however:
- Training Zones will be disabled because TRIMP scores are not optimized to be use with Training Zones.
- Cycling Power Stress Scores (PSS) will not be used because TRIMP scores compared to PSS scores is not fully reliable.
- Swimming Stress Scores (SSS) will not be used because TRIMP scores compared to SSS scores is not fully reliable.
The Heart Rate Stress Score (HRSS) described below is highly recommended instead.
Heart Rate Stress Score (HRSS)
HRSS also represents a training load based on your heart rate activity. It is based on TRIMP.
The major difference with TRIMP is that HRSS is based on athlete's Lactate Threshold Heart Rate (LTHR). LTHR is the point, above which, increased blood acidification occurs in your body.
Above this threshold your endurance performance will rapidly decrease. Basically it's the latest best average heart rate you can maintain for up to an hour. You can setup your own LTHR in athlete settings.
You should use HRSS as default heart rate stress score calculation method in the fitness trend instead of TRIMP. Because it allows a right use of Training Zones and comparison with others stress scores.
Note that HRSS is close to HrTSS® from TrainingPeaks™
Power Stress Score (PSS)
Calculated from workout power, the moving duration and the athletes Cycling Functional Threshold Power (FTP). FTP is configurable in athlete settings.
Power Stress Score is a stress score designed for cyclists having a power meter. It is the most accurate of all. The PSS is calculated from the duration of the workout, the athlete's Functional Threshold Power (FTP) and the Intensity.
Note that PSS is equivalent to TSS® from TrainingPeaks™
Estimated Power Stress Score (PSS)
Same as Power Stress Score (PSS) described above but calculation of PSS is performed on estimated power data.
Swimming Stress Score (SSS)
Calculated from workout moving duration, distance and athlete Swimming Functional Threshold Pace (SFTP). SFTP is configurable in athlete settings.
In prerequisites you have to set your Swimming Functional Threshold Pace (SFTP) in athlete settings. There is no need to wear a swimming heart rate monitor. Workout distance and active swimming time are used to compute the SSS.
You need a way to measure the distance of your workout and the time of active swimming without rest periods (before entering your manual entry in Strava).
Note that SSS is equivalent to sTSS® from TrainingPeaks™
Running Stress Score (RSS)
Calculated from workout moving duration, activity grade adjusted pace (GAP) and athlete Running Functional Threshold Pace (RFTP). RFTP is configurable in athlete settings.
The Running Stress Score is an estimated stress score for runners. It can be used as stress score input for fitness trend when a heart rate monitor isn’t available. In prerequisites you have to set your Running Functional Threshold Pace (RFTP) in athlete settings to access this stress score.
Grade Adjusted Pace (GAP) is an estimation of the equivalent flat land pace for a given running pace on hilly terrain. (Running uphill requires more effort than running on a flat grade, so GAP adjusts pace to be faster than the actual running pace. Similarly, GAP is slower than actual pace on downhill terrain).
Note that RSS is equivalent to rTSS® from TrainingPeaks™
Click on a Chart to See it Full Size

Related Strava Posts:

Leave A Comment
You must be logged in to post a comment.