I love Strava for its simplicity and reliability. I know that whatever else I might be playing with, I always have my Strava data as a backup. The thing that’s missing is comprehensive reporting and Veloviewer fixes this issue.
Veloviewer is a cloud based tool that connects to Strava using their API and lets you compare, filter, visualize, analyse and drill down into all your Strava data to discover new insights and motivational goals.
Veloviewer makes extensive use of lists (Like Spreadsheets) and one of it’s most powerful features is the filter panel which you will find at the top of every list. .
All the key Features of VeloViewer work with Stava free, except for heart rate and power zone data, for which you need the Summit Analysis Pack or a workaround.
VeloViewer has a free demo which lets you download 25 of your activities to get a feel for how it works.
When you’re ready to go Veloviewer costs just £10 a year for the PRO version or £20 a year for PRO plus which lets you re-check all of your segment placings and segments at any time (Once a week for PRO). The PRO plus version also gets you early access to Beta features and rewards the developer for giving us this awesome product.
This guide takes you through the amazing range of features that Veloviewer offers. It’s organized in the following sections which mirror the Veloviewer menu structure:
Main Menu
- Summary
- Activities
- Activity Detail View
- Segments
- Segments Detail View
- Routes
- Routes Detail View
- Challenges
- Wheel
- Infographic
- Veloviewer Signature
- Update
Top Menu
- My Data
- Leaderboards
- Other
Other Sections
- Features that are Common to all Lists
- VeloViewer Chrome Extension for Strava Website
Main Menu Items
Summary
This is your Dashboard for all your Key Metrics
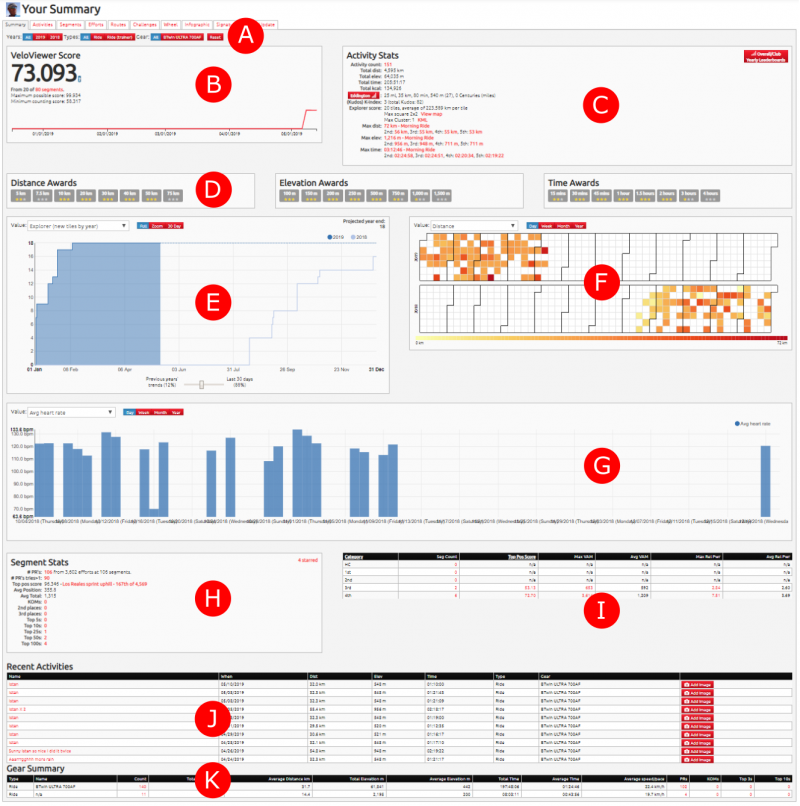
All the charts are independent of each other so changing filters on one doesn’t affect the others.
The areas of the Summary view are as follows:
A: Filters:
Years, Activity Type, Gear. The default is “all” for all three options (Highlighted in Blue)
![]()
B: Veloviewer Score
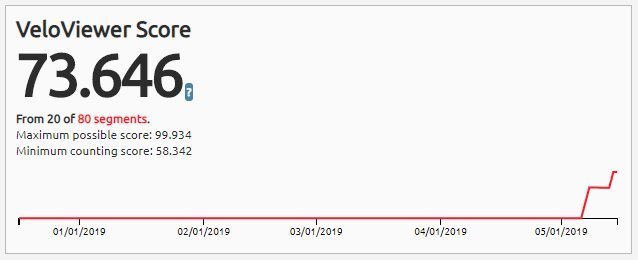
Your VeloViewer score is a way to compare yourself against your peers. It’s the average segment position score from your top 25% (max 100) of non-downhill segment attempts.
Only your top 25% of scores (to a maximum of 100) are taken into consideration to avoid including easy, non representative rides.
(Non downhill is defined as Grade >= -0.25% and is a condition set by the Strava API which doesn’t allow downhill segments to be accessed for this calculation).
The position score is a better indicator of your performance against other athletes than your actual placing.
C: Activity Stats
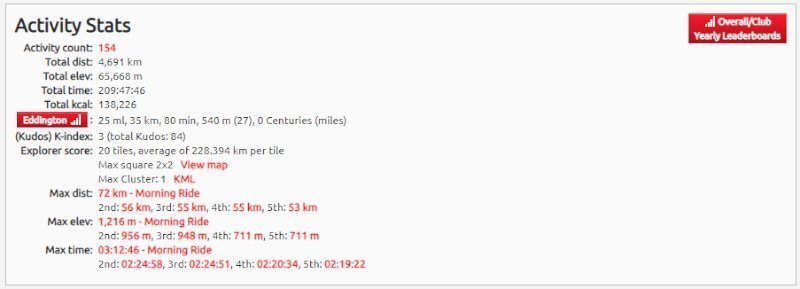
Activity stats are a summary of key metrics.
- Activity Count
- Total Distance
- Total Elevation
- Total Time
- Total Kcal
- Eddington (Click on the red button to view the Eddinton Graph)
- (Kudos) K-index
- Explorer Score
- Max Square
- Max Cluster:
- Max distance: (Top 5 Distances)
- Max elevation: (Top 5 Elevations)
- Max time: (Top 5 Times)
Most of these metrics are self explanatory but in case you haven’t come across the Eddington number before there is an excellent explanation on the Veloviewer blog.
(Kudos) K-index
The K-index (or Kudos-index) shows the impact of your activities on others.
It’s based on the h-index used for measuring "both the productivity and citation impact of the published body of work of a scientist or scholar".
If you have at least 10 Kudos on at least 10 activities then your K-index is 10.
Explorer score and Max Square
The explorer score is based on how many squares you have passed through during all your activities regardless of type (Ride, Run etc). The squares themselves are based on the standard OpenStreetMap map tile 256x256px image at a zoom level of 14. If any of your activities cross into a tile then it gets a tick.
To see your completed tiles visit the activities tab and turn on map view (toggle buttons in the top right) then turn on the Explorer option below the map.
Max Square
Here’s the real challenge: how big can you make your square of tiles? You’ll see those shown with a blue square on the Activities’ map.
A button next to the Explorer toggle below the map auto-zooms your map view to your max Explorer Square:
You'll also see the average distance traveled for each ticked tile (i.e. number of tiles / total distance).
These scores respond to any filters so you can view your current year’s Explorer stats or those for a certain activity type or gear.
You can learn more about Explorer scores and Max Squares here.
Max Cluster
Max cluster is a metric which represents the maximum number of connected Explorer tiles. The Explorer Max Square provides a hard-core challenge but can be tricky for people who live in geographically challenging areas or have key tiles which are completely inaccessible. The Explorer Cluster provides a more level playing field in these cases.
You can learn more about Max Clusters here.
D: Awards Quick Links
These three panels offer quick links to a list of your activities filtered on the metric and the value in the grey box.

Hovering over an award shows you brief summary stats, clicking on an award takes you to the filtered list.
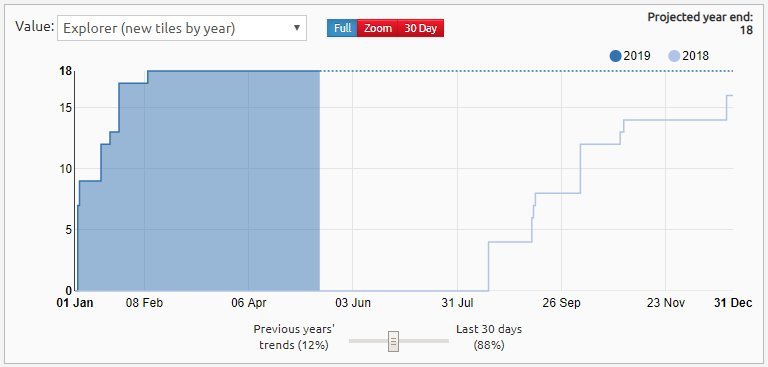
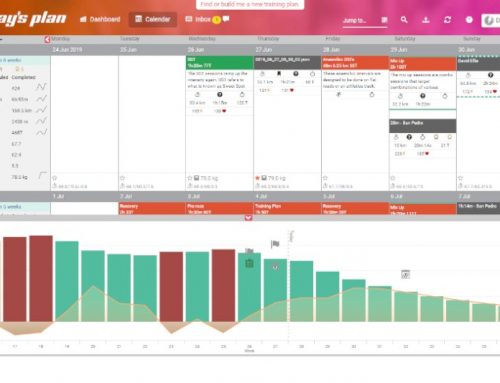
E: YTD Progress Chart
Below the Distance Awards is a chart that shows your progress on key metrics YTD with a projected value by year end. You can optionally compare this with previous years.
Select the Metric from the value dropdown.
Selecting “Full” shows the Complete Year including projected results, Zoom, shows YTD (Year to Date) and 30 days shows the last 30 days.
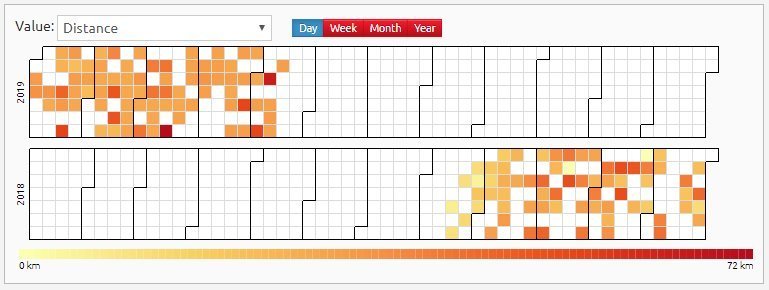
F: Heat map of key metrics by day and year
You can choose the metric from the dropdown, and then hover over a square to show a popup with brief details, or click on the square to transfer to the Veloviewer activity detail view.
Use the selector to choose the time period represented by a square: Day, Week, Month, or Year.
The density of the color as shown on the bar below the graph increases with the intensity of the activity.
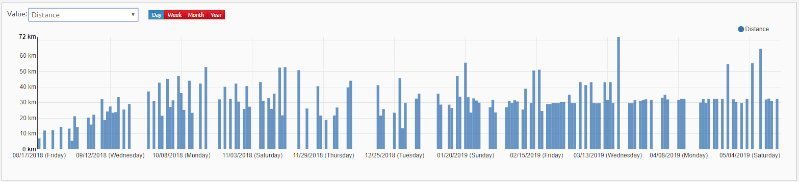
G: Bar Chart of Key Metrics
Bar charts of key metrics by Day, Week, Month or Year. Select the metric you want from the value dropdown.
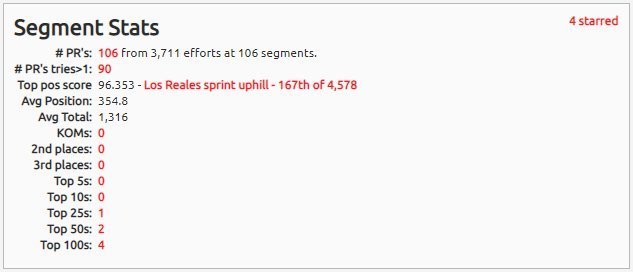
H: Segment Stats
A list of your rankings including PR and KOM Stats.
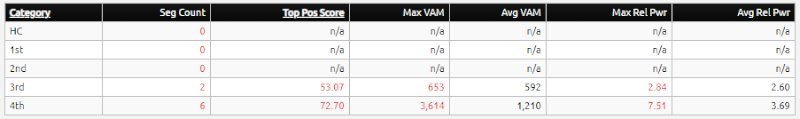
I: Climb Category stats
A list of Climbs you have attempted by category.
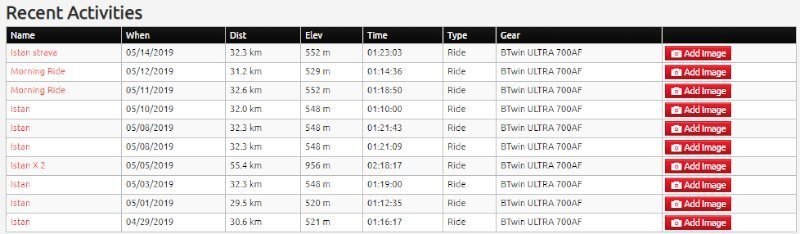
J: Recent Activities
A list of your most recent activities which lets you add an image to the Strava activity directly from this list.
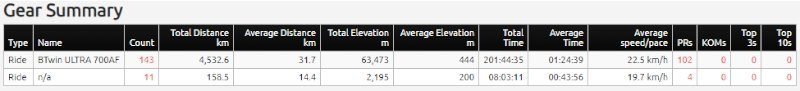
K: Gear Used
A list of your gear (equipment) with usage metrics.
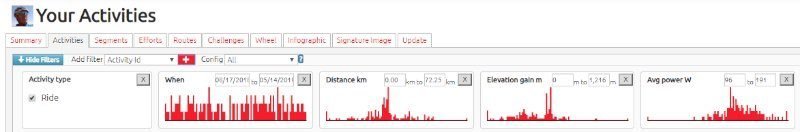
Activities
A filterable list of all your activities with all key metrics.

Click on the image to see a hi-res version
The Activities list contains links from each entry to these views
- Veloviewer activities detail view
- Strava activities view
- Strava flyby view
Activity Detail View
At the top of the view is an activity gradient chart. If you hover over the chart you will see the distance and gradient values.
This view has the following menu options:
- Map
- 3D Profile
- Segments
- Data
- Zones
- Charts
- Best Splits
- Overlaps
- Summary
- Breakdown
- 3D Map
- Earth
Map
This is the default Activity Detail View and shows
- A full view button
- A Button to toggle squares on/off
- A Map settings button that does nothing that I can see
- A Map settings button that allows you to set distance markers on/off
- A Pegman control that lets you drag Pegman onto the map to show the map and street view in a split view – Nice!
- A labeled map with +/- buttons to zoom in and out
3D Profile
This view shows your activity in three dimensions, there are various options to manipulate the image and you can output it to Print My Route who will print and frame the 3D route for you.
You can also add this image to your activity from this view.
Segments
Your segment report view for this activity.
Data
Detailed data for this activity you can choose between Line, Bar or Box (all charts will use the same format) you can also select the granularity of the Bar and Box types using the dropdown
Hovering over any of the traces shows the the spot values of all the charts.
Elevation, Speed, Power (est). Grade, Elevation Gain, Average Speed, Average Power, Time.
Zones
Heat shade the activity profile by Elevation, Speed, Power and Grade. This is useful to visualize what proportion of the activity is spent in each zone
Charts
A huge range of customizable chart types. Variables are Chart Type, X axis metric, y axis metric, and color profile.
Best Splits
Details of your best performances by split time or distance. You can choose from common splits or create your own custom split.
Overlaps
Overlaps shows a list of activities that include a section of an activity that you choose from the activity you are studying.
Summary
Shows the PR record for that activity.
Breakdown
Shows Charts of Direction of travel and grade by distance traveled.
3D Map
A map with the activity displayed in 3D.
Earth
An Earth map that lets you fly above, along and around your activity in 3D.
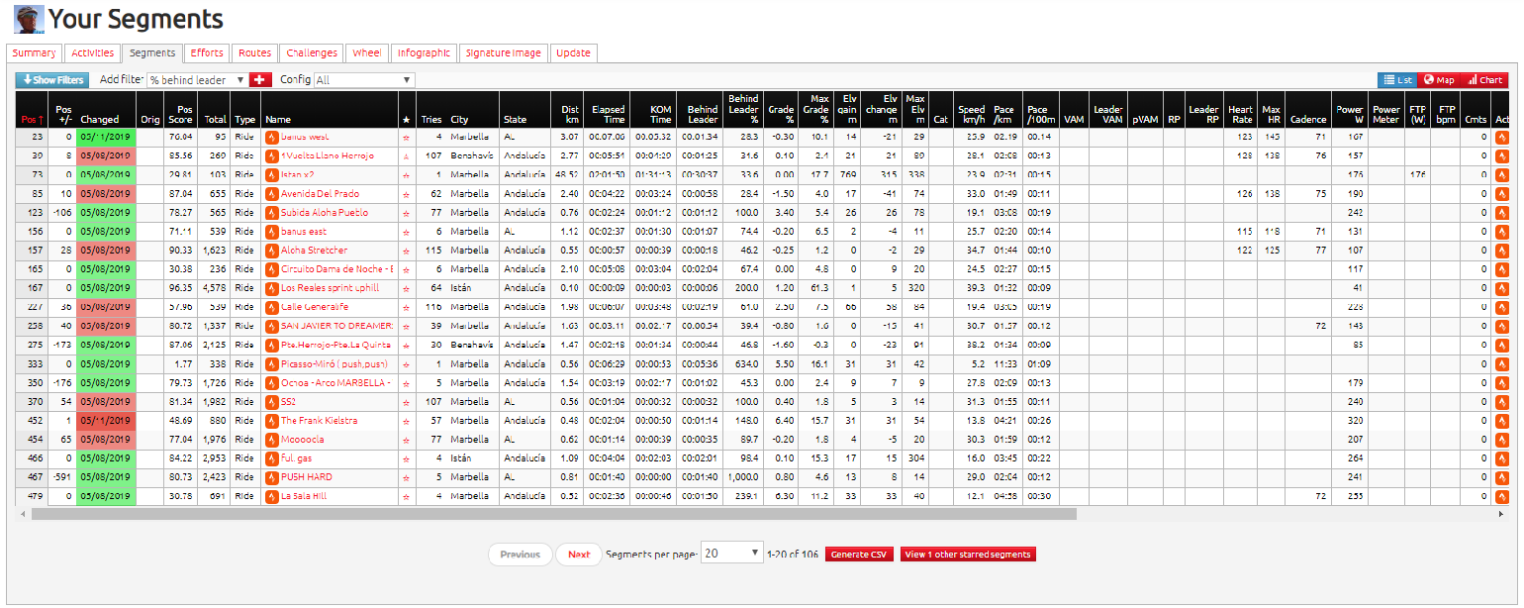
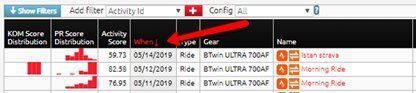
Segments
A filterable list of all your Strava segments
Everyone loves Strava segments, and this list tells you everything you need to know about your segment challenges, performance and rankings including:
How many athletes completed the segment. The number of time you’ve tried it. Your position score. Distance behind the leader (time and %). Grade, Speed, Power, Cadence and much more including links to the Veloviewer and Strava Segment detail views.

Click on the image to see a hi-res version
The Segments List contains links from each entry to these views
- Veloviewer segment view
- Strava segment view
- Veloviewer activities view
- Strava activities view
- Strava flyby view
The Changed column entries are color coded as follows:
Days since last change: The Background colors in this column shows last change: Red for down (bad), Green for up (Good) and the color saturation shows how long ago: Deep red/green today, very faint red/green 2 weeks ago.
View Other Starred Segments
At the bottom of this view is a useful button that shows if you have starred other segments but have not yet completed them (so they won’t show on this list).
Clicking on the button opens a pop up with links to the Strava and Veloviewer detail views and a button that lets you unstar the segment.
Segments Detail View
This view has the following menu options:
- Details
- History
- Leaderboard
- Comments
- Breakdown
- 3D Map
- Earth
- Street View
- Compare
Details
3D/2D Map Options: 3D, 2D, Spin, Get Image (Download image lots of options Embed (embed Code) 3D Print (Get in printed by Printmyroute) you can toggle a variety of distance markers on or off and stretch the gradient to increase the size of the representation.
Detailed Map with lots of options including:
Segment stats
- Type: Ride
- Distance: 3.1 km
- Elev Gain: 14 m
- Elev Change: -21 m
- Avg Grade: -0.3 %
- Max Grade: 10.1 %
- Climb cat: n/a
- VVOM:
- Min Elevation: 8 m
- Max Elevation: 29 m
- KOM tries: Not known
- KOM athletes: 94
- KOM elapsed time: 05:32
- KOM moving time: 05:32
- KOM speed: 33.3 km/h
- KOM VAM: n/a
- KOM RP: n/a
PR Stats
- Position: 23rd
- Elapsed time: 07:06
- Moving time: 07:06
- Behind KOM: 01:34 (28.3%)
- KOM Pos Score: 75.7895
- Speed: 25.9 km/h
- Relative Pwr: 0.00 Watts/Kg
- VAM: 0 m/h
- Gear: BTwin ULTRA 700AF
- Activity: Afternoon Ride
- When: 12/19/2018
Chart: Raw Elevation.
Chart: Gradient by Distance.
Links:
RaceShape/Compare your PR (On Strava): Takes you to Strava Effort Comparison where you can compare your effort with the current KOM for this segment.
View on Strava (external): Takes you to the Strava view for this segment.
Update segment details: Update/Refresh segment details with Strava.
Request placing re-check: Pressing this button will check your current position on all of your segments.
Note: When looking at your activity details in Strava the placings shown are fixed at the time you uploaded your activity or when you last updated your placings.
For performance and bandwidth reasons the number of segments you can check at a time will vary based on the number of other users on the site.
Download Start/End Waypoints
Downloads a GPX file of the Segment.
History
List with details of every attempt you have made on this segment, You can filter this list.
Leaderboard
Leaderboard for this segment.
Comments
Comments about this segment.
Breakdown
Shows Charts of Direction of travel and grade by distance travelled.
3D Map
A map with the activity displayed in 3D.
Earth
An Earth map that lets you fly above, along and around your activity in 3D.
Street View
Street view version of this segment with the choice of various mapping types and the ability to use Pegman to show streetview and the map in split view.
Compare
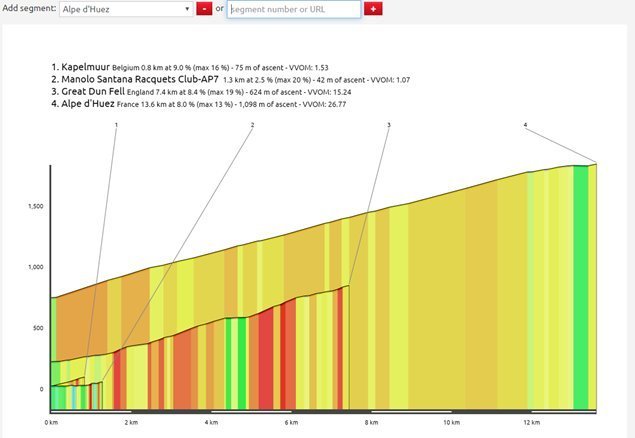
Compare this segment with another segment that is well known to the Veloviewer community. For example Box Hill in the UK or Alpe d’Huez in France.
Use the Dropdown to select and the +/- Arrow to remove segments. You can add multiple segments.
Use your segment list to find the segment you wish to compare and right click on the segment name and copy the link address.
Find segments you haven’t previously completed using the Strava Segment Explorer or from the segment list of your Routes.
To remove segments from the comparison, select the segment from the drop down list (ones added by number/URL will appear at the bottom of the list) and press the button next to the list.
Alt+Click the button next to the drop down list to open the selected segment’s details view:
Efforts
A filterable list of all your Strava efforts
The efforts list shows similar information to the Segments list but as default shows every attempt you have made on every segment. You’ll definitely want to use filters on this view
Click on the image to see a hi-res version
The Efforts List contains links from each entry to these views
- Veloviewer segment view
- Strava segment view
- Veloviewer activities view
- Strava activities View
- Strava flyby View
Routes
A filterable list of all your Strava routes

Click on the image to see a hi-res version
This view gives you a list of your routes including these columns:
- Date Created
- Type
- Sub Type
- Name
- Dist km
- Elev m
- Starred
- Private
- Distance away km
- Description
The Routes Detail List contains links from each entry to these views
- Strava routes view
- Veloviewer routes detail view
Routes Detail View
At the top of the view is an activity gradient chart if you hover over the chart you will see the distance and gradient values.
This view has the following menu options:
- Map
- 3D Profile
- Segments
- Breakdown
- 3D Map
- Earth
Map
This is the default Activity Detail View and shows
- A full view button
- A Button to toggle squares on/off
- A Map settings button that does nothing that I can see
- A Map settings button that allows you to set distance markers on/off
- A Pegman control that lets you drag Pegman onto the map to show the map and street view in a split view – Nice!
- A labeled map with +/- buttons to zoom in and out
3D Profile
This view shows your activity in thre dimensions, there are various options to manipulate the image and you can output it to Print My Route who will print and frame the 3D route for you.
You can also add this image to your activity from this view
Segments
A detailed list of the segments on this route.
Breakdown
Shows Charts of Direction of travel and grade by distance traveled for this route.
3D Map
A map with the route displayed in 3D.
Earth
An Earth map that lets you fly above, along and around your activity in 3D.
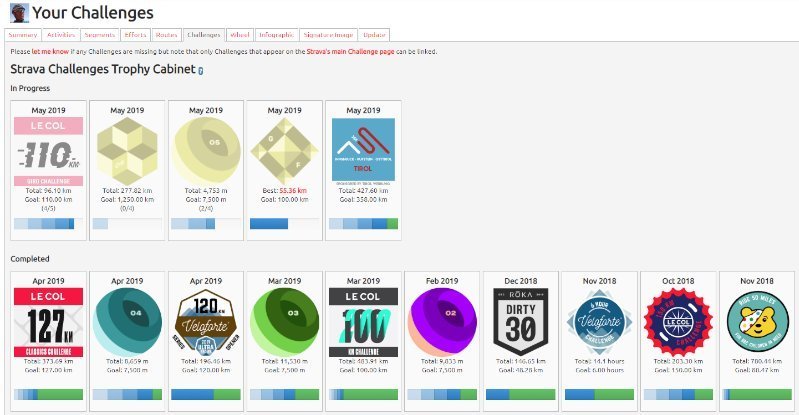
Challenges
This view shows a list of Strava challenges. It doesn’t show your personal progress or results
Wheel
This Feature will make you happy!
The Wheel shows all your activities for a selected time period on a wheel. Rides are orange, runs are blue and other activity types are green:
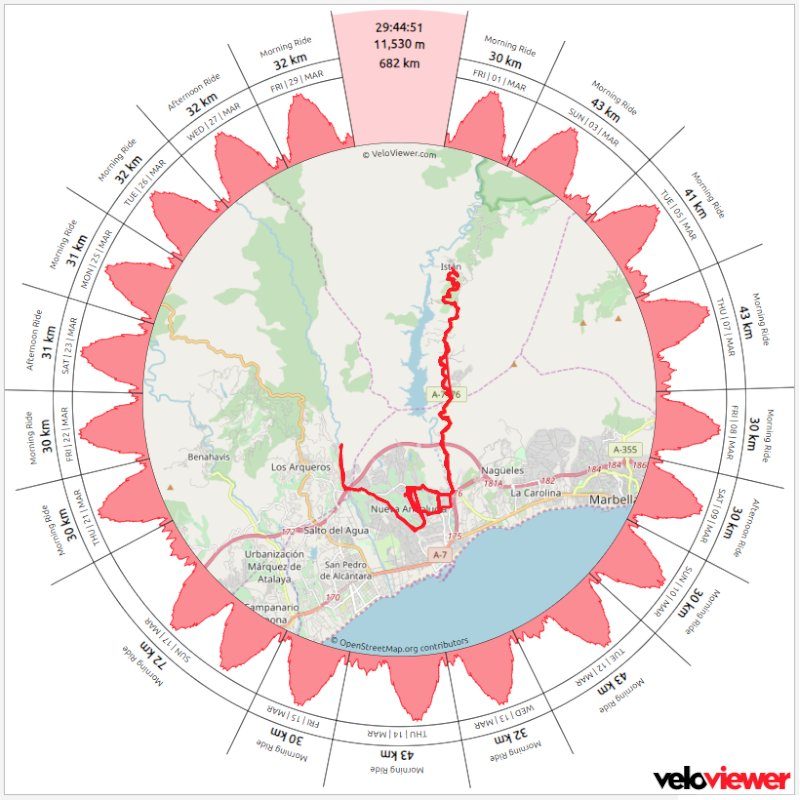
Filter by month or data range, include or exclude commutes and virtual rides. You control what kind of map in the center of the wheel is displayed.
Clicking on any of the activities spins the wheel round and the map for the selected activity is then displayed in the center.
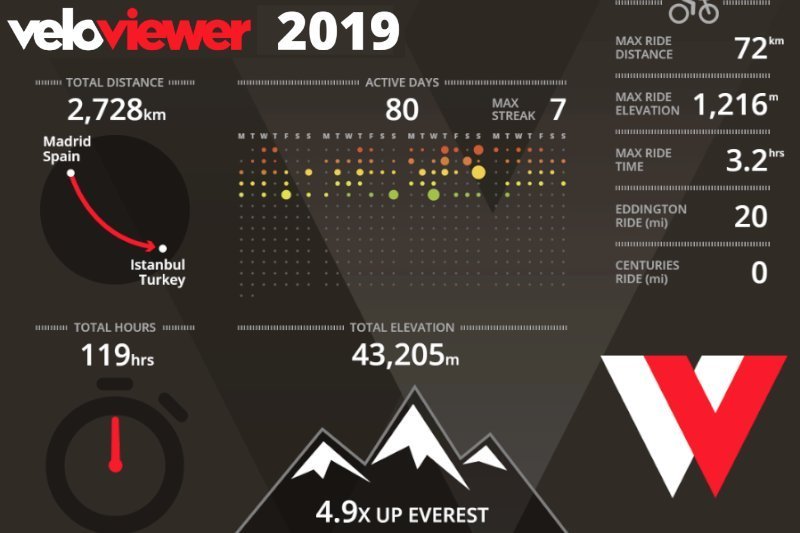
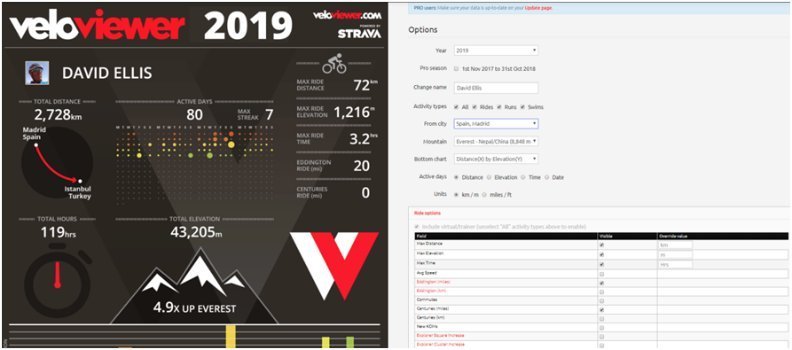
Infographic
Another “Happy” feature. This is really slick, and perfect for any social media sites you have (Make sure to tag @veloviewer).
There are loads of options you can use to get the Infographic just right before you share it. I think the design is fantastic.
Signature Image
You can create a personal Signature image to use in forums you participate in. You can choose to display the metrics you are most proud of.
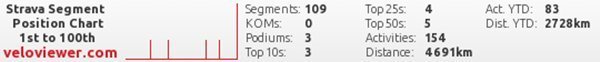
The signature generator creates a URL to the png file, Raw HTML and the BB code that some forums use.
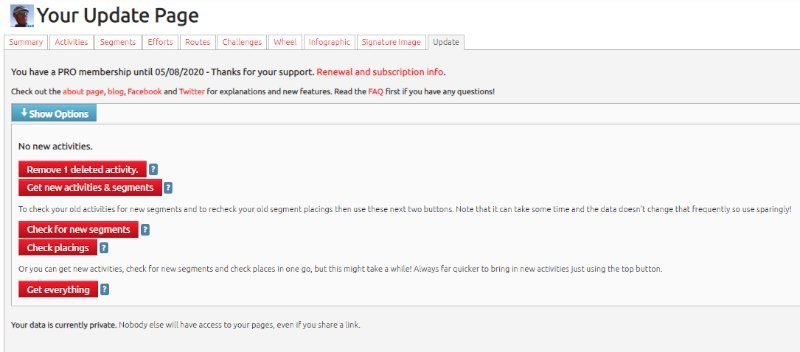
Update
The update view shows you the current state of the sync. between Strava and Veloviewer. You need to check this manually as it does not automatically update.
If you ever think you’re missing data this is the first place to look. You can use the buttons to choose what you update or “Get Everything”.
Clicking on the blue "show options" button lets you change your personal settings.
Top Menu Items
Your Data
Dropdown access to the main menu items which are also shown in the head of each view
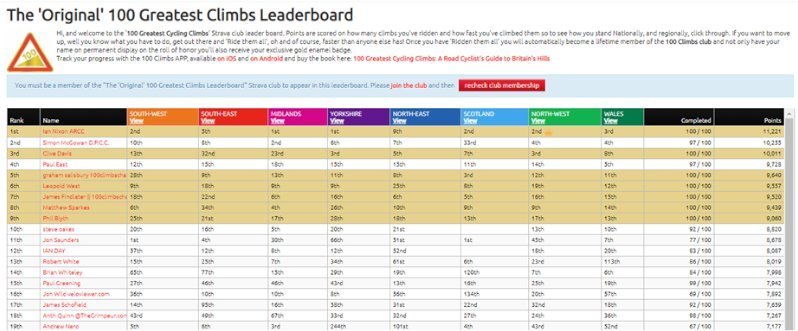
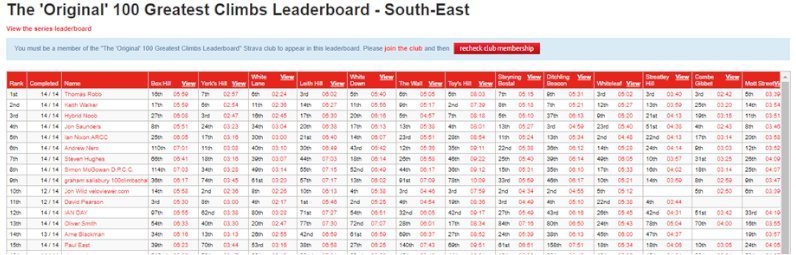
Leaderboards
This feature gives you access to updated lists of popular leaderboards
Clicking on an athlete’s name takes you to their Strava Profile view in Strava.
Clicking on the view link below the country takes you to a detailed view for that country.
Other
Various housekeeping options and an FAQ Link.
Features that are Common to all Lists
Veloviewer is based on lists (Spreadsheets), Filters and Charts which give you a great overview of your data. These Features that are Common to all Lists:
Column Sort
Hover over Columns Headers to show a tooltip with column description.
Columns can be sorted Max/Min or Min/Max by clicking on the header.
The current sort Column text is highlighted red with an up or down arrow depending on the sort order.
When you open a list you can see the current index column has text highlighted in red (all the others will have white text).
To change the sort order click on the column header.
To change the index column used click on the column header of the one you want to use and click again if you want to change the sort order.
It's not possible to have cascading sort columns ie: Sort by column 1 and then by column 4.
Filters
Add Filter lets you manage filters relevant to the list you are in, click in the down arrow and choose the filter you want to add from the drop down, then click the red & white “plus” button to add it to the filter area.
You can add multiple filters and then add filter ranges to each filter.
To remove individual filters click on the cross in the top right corner.
The “Config” Filter lets you quickly filter by activity type: All, Ride or Run.
The Blue Hide Filters button lets you open and close the filter panel. Applied filters continue to apply when the panel is closed (hidden).
List Navigation
At the bottom of each list view is a navigation menu with the following action:
Previous View, Next View, Number of rows per view selector dropdown (Segments in this case). You can choose from between 10 and 1000 per view. Range of records displayed out of total number of records.
![]()
In this example you can also view this list as a wheel and download it as a csv file, This is a good way to export data from Strava that Strava doesn’t make easily available without using it's API.
Common Links to other views
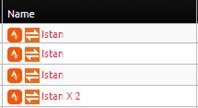
Wherever you see an entry in red with the Strava logo next to it you can click on the Strava logo and be taken to the Strava view for that entry or click on the text and be taken to the Veloviewer view relevant to that entry.
Sometimes you will see a Double Headed Arrow and clicking on this takes you to the Strava flyby view.
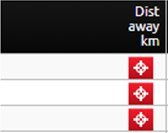
Distance Away Km
This is the distance of the Route or segment from your current location. When you first open the view you will see it populated with red compass icons. Click any one of these to automatically check your location and populate the whole column with the correct values.
View Selector
On all lists these three buttons in the top right hand corner let you toggle between views, Blue is show and Red is hide, click to toggle.
![]()
So in the example shown you would just see the list. If all three are Blue you will see the three views tiled in the view.

Click on the image to see a hi-res version
VeloViewer Chrome Extension for Strava Website
This extension adds a Veloviewer menu to Strava with direct links to these views:
- Summary
- Infographic
- Update
- Everesting Submission
- Original 100 Greatest Cycling Climbs
- Another 100 Greatest Cycling Climbs
It also adds links on certain Strava views to the relevant Veloviewer view:
- Direct links to VeloViewer segment details view throughout the Strava site.
- Direct links to Activities.
- Direct links to Routes.
- Direct links to Club yearly leaderboards.
- VeloViewer Explorer tiles highlighted in Strava Route Builder including completed tiles, max square(s) and max cluster.
- Chronological ordering on your dashboard feeds
VeloViewer Chrome Extension for Strava Website
This extension adds a Veloviewer menu to Strava with direct links to these views
- Summary
- Infographic
- Update
- Everesting Submission
- Original 100 Greatest Cycling Climbs
- Another 100 Greatest Cycling Climbs
It also adds links on certain Strava views to the relevant Veloviewer view:
- Direct links to VeloViewer segment details view throughout the Strava site.
- Direct links to Activities.
- Direct links to Routes.
- Direct links to Club yearly leaderboards.
- VeloViewer Explorer tiles highlighted in Strava Route Builder including completed tiles, max square(s) and max cluster.
- Chronological ordering on your dashboard feeds
You can get the Veloviewer Chrome extension here
Related Strava Posts:


Leave A Comment
You must be logged in to post a comment.