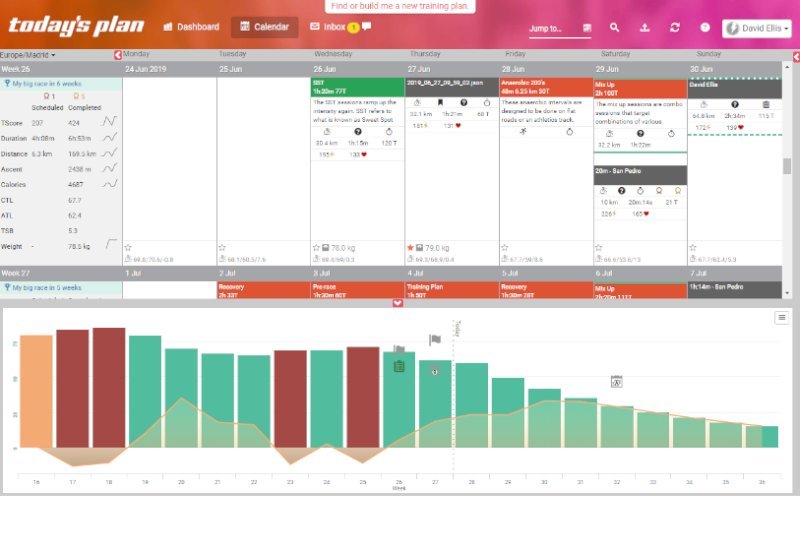
The Calendar Explained
The calendar is very well designed; in the example below you can clearly see each of my activities with a couple of KPIs. Data source, Distance, Time, Average Power and the Tscore.
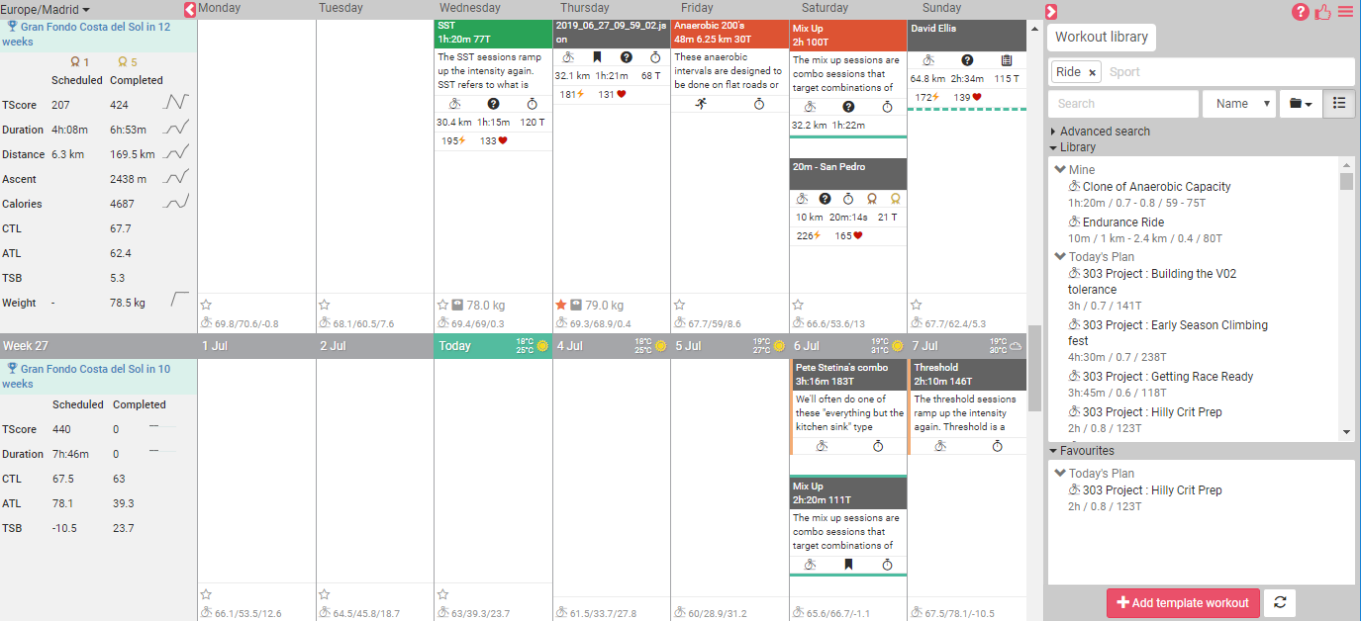
The left side bar of the calendar
Here you’ll find the weeks key performance indicators (KPIs), you can see both scheduled (prescribed) and attempted (which may or may not have been completed. You will also see small awards icons which show your achievements.
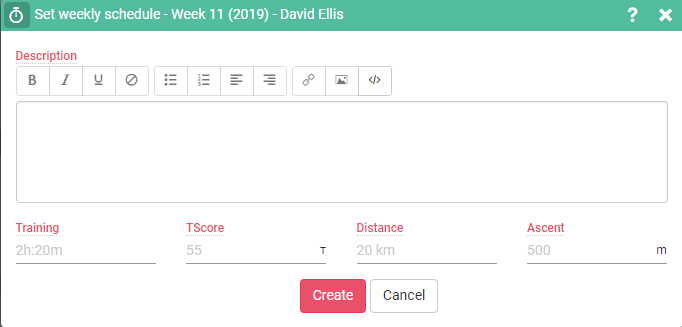
Clicking the grey section reveals a + sign, click on this and you can set global targets for the week:
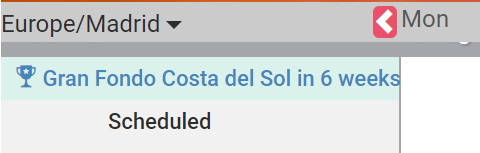
You can see the Gran Fondo event I am training for (highlighted with a blue background).
The right side bar of the calendar
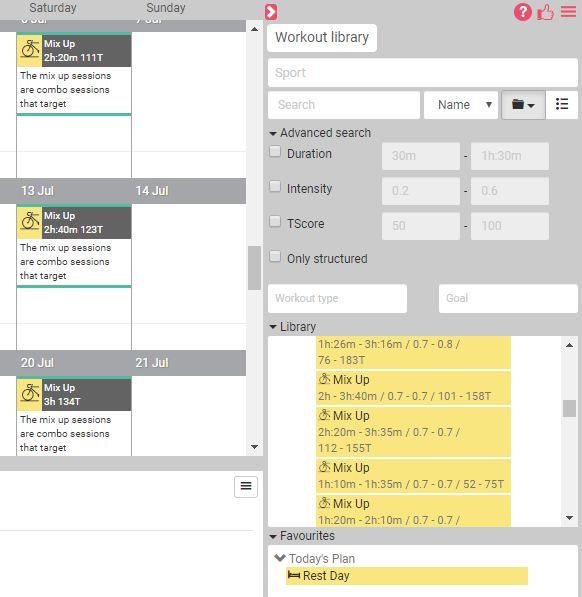
This shows the workout library. You can drag and drop one or more workouts onto the calendar from here.
You can also add a new workout template from here
Opening and Closing Sidebars
The sidebars and the performance management chart (see below) can be closed to allow more room for the calendar. To close either sidebar, click on the relevant white arrow (red background) at the top of the view.
Click on the arrow again to open the sidebar.
Add Items to the Calendar
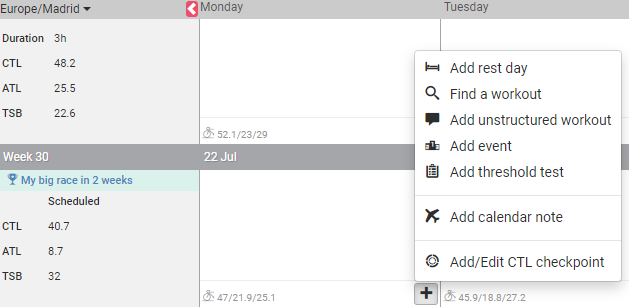
Hovering over the bottom of a date cell on the calendar reveals a + sign, clicking on this opens a menu that is context sensitive to the date (if its in the past, today or in the future).
The items are self explanatory except for add/edit CTL checkpoint:
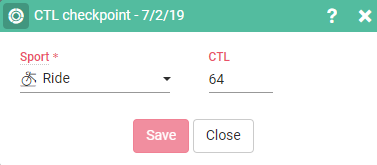
Add CTL Checkpoint
The add/edit CTL checkpoint window allows you to override all load calculations and set a sport specific value on any given date. Simply choose the sport you want to apply this to and enter the CTL value for that date.
The Calendar View Performance Management Chart
At the bottom of the calendar view is this alternative representation of the PMC/Load chart
Clicking on the hamburger menu (top right of the chart ) opens the chart options panel:
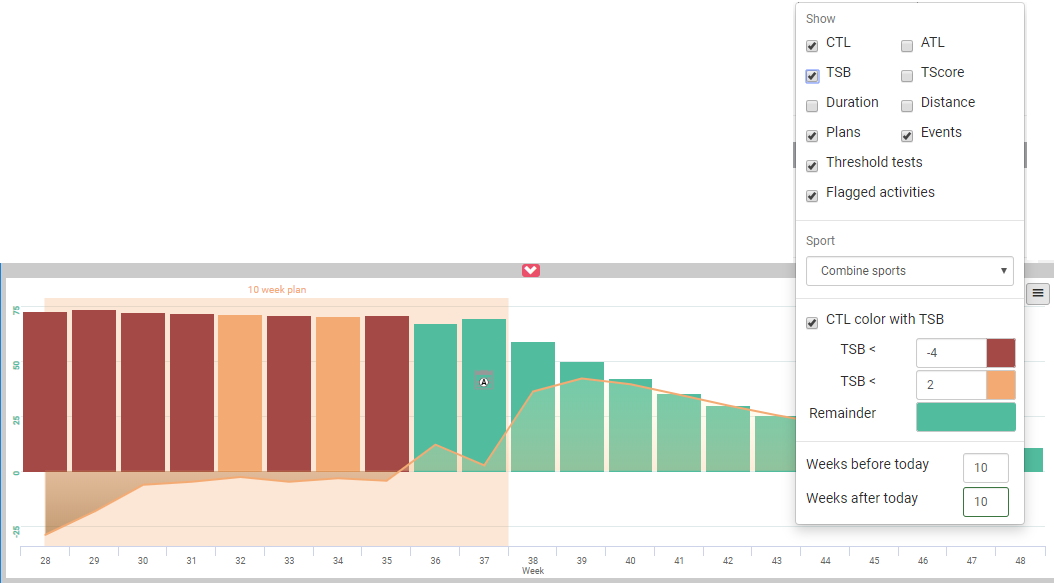
Clicking on the white arrow (red background) above the chart opens or closes the chart
Information available in the calendar view
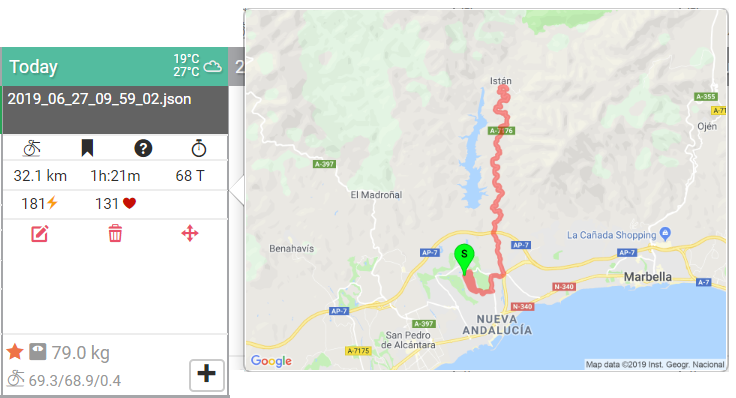
The activity summary entry in the calendar packs in a lot of information including
Hovering over the first KPI line for the activity opens a popup map showing the route:
The Activity Summary
Header Color Coding: If there was a planned workout that day the header is colored green (if there wasn’t it is black) and you can see a synopsis of the workout description.
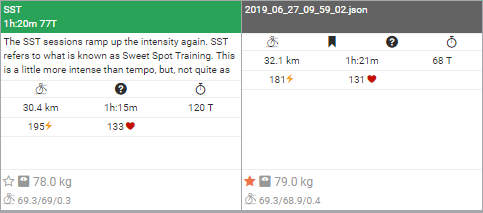
The Header color code for an activity matching a workout is as follows:
- Red: Outside ± 35% of the scheduled workout duration
- Orange: Between ± 15% and ± 35% of the scheduled workout duration
- Green: Inside ± 15% of the scheduled workout duration
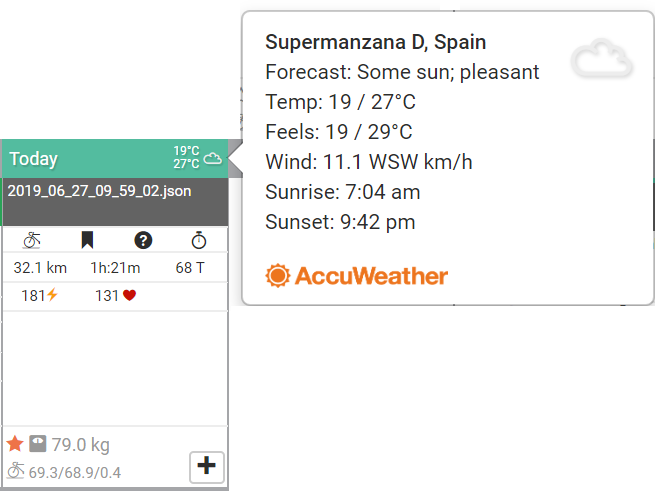
Weather forecast: (hover over summary to see details popup including real feel) this is shown for the next 5 days (Including today). You can still see the min/avg/max temperatures in the ride summary:
The File Source: if applicable
Sport: (Bike Icon in this example)
Bookmark: (Bookmark icon), This shows the activity is favorited (or not) and can be found using the filter in Quick Search for example
Review Status: (Question mark shows this activity has not been reviewed)
KPI Values: Distance, Activity time, Tscore, Average Power, Average Heart Rate.
Achievements: Personal best for the activity
Subjective Wellness: Lets you log your personal opinion on a number of subjective training criteria:
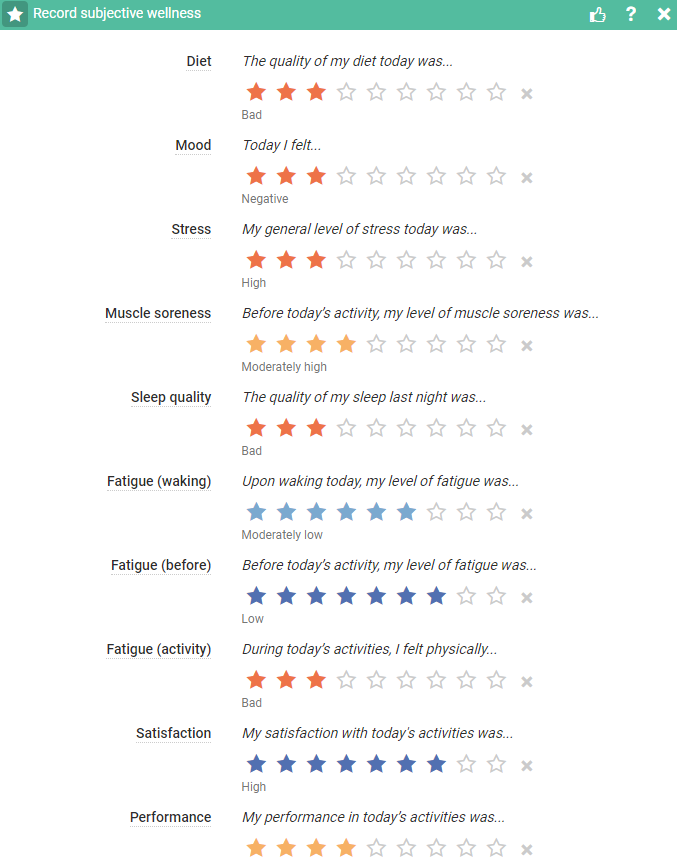
- Diet: The quality of my diet today was...
- Mood: Today I felt...
- Stress: My general level of stress today was...
- Muscle soreness: Before today’s activity, my level of muscle soreness was...
- Sleep quality: The quality of my sleep last night was...
- Fatigue (waking): Upon waking today, my level of fatigue was...
- Fatigue (before): Before today’s activity, my level of fatigue was...
- Fatigue (activity): During today’s activities, I felt physically...
- Satisfaction: My satisfaction with today's activities was...
- Performance: My performance in today’s activities was...
Grey outline star: wellness survey not completed, Click on the star to open the dialog to add your subjective wellness values
Gold star: wellness survey completed, hover over the star to see your values
Weight: The current weight of the athlete.
Form Stats: CTL/ATL/TSB values following this activity
Clicking on the cell opens the Activity Analysis popup
